
Computational Study on Valve Lift Dynamics and Stoichiometric Behaviour of Four-Stroke Renault IC Engine Process
Abstract
In this research, a computational study of valve lift dynamics and stoichiometric behaviour was carried out to determine the efficiency and power output of a four-stroke Renault IC engine. The CAD model profile of the IC engine was developed using SOLIDWORKS software, which was later imported into ANSYS Fluent version 15.0 as a geometry saved in the Initial Graphics Exchange Specification (IGES) file format to enable the simulation process. The valve lift profiles were varied to study their impact on the engine's performance. From the simulation profile, a maximum in-cylinder combustion temperature of 841 oC occurred when the engine ran at idle load. However, a maximum in-cylinder temperature of 2254 oC was observed when the engine operated at full load. The maximum flame development phase at variable valve lift openings (ranging from 5-13 mm) was 36, while the maximum in-cylinder flame propagation phase was 42, leading to a volumetric efficiency of 0.822%. The plotted simulation results indicated that increased valve lift opening allowed more air-fuel entry into the combustion chamber, resulting in increased flow coefficient and enhanced engine performance. The relationship between engine speed and volumetric efficiency at various valve lift openings typically illustrated a curve that began at zero volumetric efficiencies when the engine was in idle mode and the valves closed. The volumetric efficiency gradually increased as the valve opened and attained a peak value of 0.904% when the valve was fully open at 13 mm and an engine speed of 3000 rpm. The relationship between engine speed and Specific Fuel Consumption (SFC) at various valve lift openings revealed that, as the valve lift opening increased, the air-fuel mixture entering the combustion chamber also increased. This led to higher power output as well as higher fuel consumption, as more fuel is required to maintain the combustion process at higher power levels or engine speed. However, excessive valve lift opening can increase turbulence and heat losses, reducing the engine's efficiency. The relationship between engine speed and indicated power at various valve lift openings revealed that increasing engine speed led to increasing power output from the engine up to a certain point where the engine reached its maximum power output.
Keywords:Friction stir weldingManufacturing industriesMetal joiningProduct performance
1. Introduction
The study of Internal Combustion Engines (ICE) has been a topic of interest for researchers and engineers for many years. One of the key components of an ICE is the valve system, which controls the flow of air and fuel into the combustion chamber. The dynamics of the valve lift play a crucial role in determining the performance and efficiency of the engine [1], [2]. The ICE has been a crucial component in the automotive industry for over a century. With the increasing demand for more efficient and environmentally friendly vehicles, researchers have turned to computational studies for improved engine performance. The four-stroke engine, also known as the Otto cycle, is the most common type of ICE used in automobiles [3], [4]. It consists of four stages: intake, compression, power, and exhaust. The engine's efficiency is determined by how well these stages are executed. Computational Fluid Dynamics (CFD) is a powerful tool that allows researchers to simulate the flow of air and fuel within the engine. By analyzing the flow patterns, researchers can optimize the engine's design to improve performance and reduce emissions [5], [6]. One of the key parameters that researchers focus on is the combustion process. By simulating the combustion process, researchers can fully comprehend the principles of an in-cylinder fuel-air mixture to ensure complete combustion and maximum power output [7], [8].
This is crucial for improving the efficiency of the engine. The valve lift dynamics refer to the motion of the valves as they open and close during the engine cycle [9], [10]. The valve lift profile is crucial in determining the amount of air and fuel that enters the combustion chamber and the timing of the combustion process [11], [12]. CFD simulations can analyze the valve lift dynamics and optimize the engine's performance. On the other hand, the Stoichiometric behaviour of an engine refers to the ratio of air to fuel required for complete combustion [13], [14]. The stoichiometric ratio is the ideal ratio at which all the fuel is burned completely with the available oxygen in the air [15], [16].
In a four-stroke engine, the stoichiometric ratio is typically around 14.7:1, meaning that 14.7 parts of air are required for every part of fuel [17], [18]. By studying the stoichiometric behaviour of the engine, researchers can optimize the fuel injection timing and air intake to improve the efficiency and performance of the engine. The Renault IC engine is popular for automotive applications due to its reliability and performance [19], [20]. By conducting a computational study of the valve lift dynamics and stoichiometric behaviour of the Renault IC engine, valuable insights into its performance can be gained, leading to informed decisions on improving its efficiency [21], [22]. Over the years, several studies have been conducted on valve lift dynamics and stoichiometric behaviour of four-stroke IC engines. For example, Ikpe and Bassey [23] conducted a study on CFD of the charging behaviour in the cylinder of a four-stroke spark ignition reciprocating engine, focusing on different valve lift opening clearances. The CAD model of the engine was designed using SOLIDWORKS 2019, while the in-cylinder charge behaviour was simulated using ANSYS Fluent 14.5. The increase in valve lift opening clearance resulted in a greater amount of air-fuel mixture entering the cylinder via the intake valve. This led to a rise in the temperature of the mixture inside the cylinder and a notable enhancement in the efficiency of the combustion process, both in terms of volume and mechanical performance. Additionally, it was noted that the cylinder's ability to retain heat may be most efficient at a lower valve lift, resulting in minimal or no losses. Conversely, a considerably high cylinder charge temperature may lead to a decrease in the density of the intake charge. Clenci et al. [24] experimented on a port-injected engine to investigate the effects of varying intake valve lifts during low-lift idle conditions. The study's findings indicated that regulating the maximum intake valve lift makes managing the intake quality and intake flow rate possible, leading to enhancements in the air-fuel mixing process and in-cylinder vortex dynamics. The study also showed significant fuel efficiency enhancements and cycle variability reduction. Hence, adjusting the lift of the intake valve can compensate for the decrease in flow rate caused by the valve clearance, which can have a negative impact on the efficiency and stability of combustion.
Ikpe and Owunna [25] designed a model for a single-cylinder ICE that accurately depicted the four stages of a two-stroke cycle: intake, compression, expansion, and exhaust. In their model, they considered the engine to be a closed system. The temperature of the combusted gas in the cylinder of the ICE was seen to be precisely proportional to the in-cylinder gas pressure when the air-fuel combination was close to optimum circumstances (14.7:1), and both compression and expansion were co-occurring. Temperature of the combusted gas ranged from 293.92 to 3000.60 K, while the cylinder gas pressure ranged from 60.76 to 80.20 bar. The maximum temperature of the engine at equilibrium was found to be 2367.56 K, and the maximum shear stress was determined as 176 x 102 MPa. These calculations were made using a heat transfer coefficient of 581.236 W/m2K. Sawant and Bari [10] investigated the effects of modifying the Intake Valve Timings (IVT) and valve lift at various engine speeds on engine performance, especially regarding torque and power. It was discovered that the modifications led to a mean improvement in performance of 6.02% over the whole spectrum of engine velocities, ranging from 3000 to 9000 rpm. Furthermore, the modifications made to the diverse Valve Lifts (VVL) and Variable Valve Timings (VVT) resulted in a reduction in Brake-Specific Fuel Consumption (BSFC) of about 0.35% across all engine speeds.
Ikpe and Owunna [26] employed MATLAB 2018b to develop a four-stroke Renault ICE model and conducted simulations on the model's operational efficiency, which was Mercedes-Benz 250SE W108. The displacement volume and the lowest volume filled by the in-cylinder charge were 4.65x10⁻⁴ mm3 (equivalent to 4.65x10⁻⁷ cm3) and 0.5x10⁻⁴ mm3 (equivalent to 5x10⁻⁸ cm3). The simulated data captured maximum pressure at a crank angle of 30 degrees, but the experimental data recorded it at 22 degrees. Kumar and Jayashankar [27] conducted a CFD simulation to examine how valve lift affects fluid flow in an ICE cylinder. The engine had an intake port diameter of 46 mm, a valve diameter of 43 mm, and a cylinder length and diameter of 562 mm and 93.65 mm, respectively. The findings demonstrated that the valve lift significantly impacted the flow velocity regime within the cylinder. Therefore, when the valve lift increased, flow separation became more crucial, resulting in increased losses in the vicinity of the valve opening.
Akele et al. [28] conducted a flapper flow analysis on ICE to ascertain the flow and swirl characteristics at various valve lifts. The model's shape was designed using ANSYS Design Modeller, featuring a single cylinder, intake port, exhaust port, and valves. The airflow within the cylinder experienced turbulence as it moved against the cylinder wall, undergoing a stroke motion. This motion helped to provide consistent combustion within the cylinder while also causing an increase in the intake mass flow as the valve lift also increased. Ikpe et al. [29] performed a port flow study on ICE that incorporated a valve lift of 8 mm, utilizing ANSYS R-16 software. The velocity and mass flow rate magnitude were observed using simulated profiles and cut planes. The angular velocity of the cycle was computed using SOLIDWORKS 2017. The crankshaft's average angular velocity was determined to be 1315 rpm, exhibiting a percentage variance of less than 20%. The velocity of charge, calculated by considering each component's area, was found to be 11 m/s. The equivalent mass flow rate was determined to be -0.055479 kg/s. The flow rate at a diameter of 8 mm was determined as 0.005417 kg/s.
The swirl intensity in the engine cylinder grew linearly along the stroke length. A higher swirl number led to a more evenly distributed radial temperature and a decrease in the flame temperature within the cylinder. The analysis of the influence of valve lift on the performance of a single-cylinder ICE using fluid dynamics is an intricate and time-consuming process, frequently necessitating data from experimental operations [30]. Nevertheless, employing computer-aided modelling and simulation to connect theoretical concepts with the in-cylinder thermodynamics of the ICE can enhance efficiency and minimize simulation time, leading to optimal outcomes.
This study aimed to employ modelling, simulation, and computational techniques in studying the effects of valve lift dynamics and stoichiometric behaviour of the four-stroke Renault IC engine. The study also included the relationship between valve lift openings and flow coefficient, engine speed and volumetric efficiency at various valve lift openings, engine speed and Specific Fuel Consumption (SFC) at various valve lift openings, and engine speed. It indicated power at various valve lift openings.
2. Materials and Method
The subject of the investigation was a Nissan Primera inline engine, hypothesized to function based on a four-stroke cycle. The cylinder ports, valve seats, and head were designed using SOLIDWORKS 2018 and then imported into the IC engine workbench on ANSYS R-15. The cylinder head was partially modelled due to its symmetry, which reduces the computational time required for analysis. Figs. 1(a) and 1(b) display the front and end views of the ICE model, while Fig. 1(c) illustrates the cylinder port, including the intake and exhaust valves. The ICE parameters and specifications are presented in Table 1.
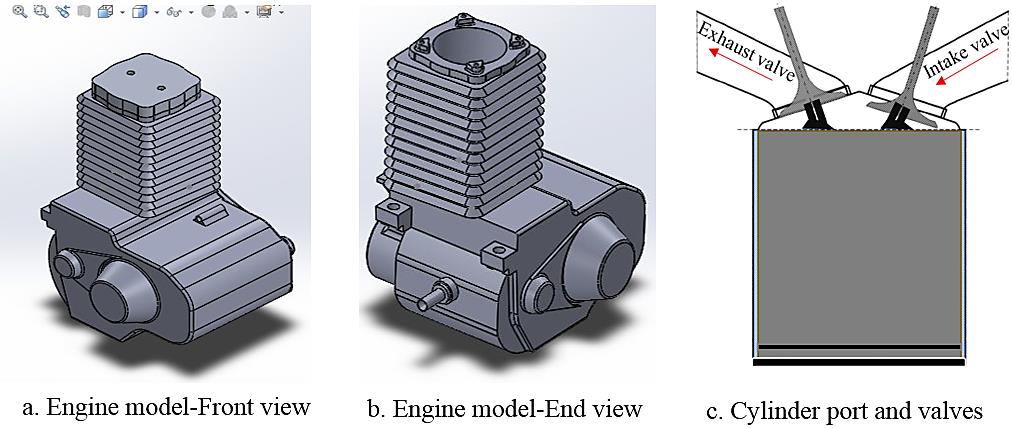
Table 1. The ICE parameters and specification.
This table is shown in the PDF version of the article.
The poppet valve shuts progressively as the reciprocating piston descends in the cylinder due to the increasing momentum of the crankcase pressure. Prior to the completion of the stroke, the pressurized in-cylinder air-fuel mixture within the crankcase undergoes high-temperature-high-pressure flame expansion, as illustrated in Fig. 2. The expanded air-fuel mixture enters the primary cylinder and experiences compression and expansion at elevated temperatures and pressures before being expelled from the ICE due to the intake port being uncovered by the reciprocating piston as it proceeds towards the end of its stroke. The Navier-Stokes and nonlinear continuity equations are fundamental partial differential equations that govern the behaviour of incompressible and Newtonian fluids [31], [32]. These equations provide a comprehensive description of the in-cylinder fluid flows.
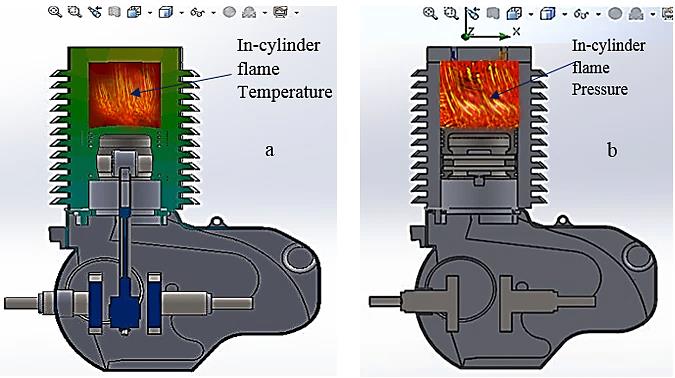
cut section showing in-cylinder flame temperature, b. cut section showing in-cylinder flame pressure.
Governing continuity and Navier-Stokes equations are typically used as closed-form nonlinear solutions for complex flow problems like the in-cylinder flow in spark ignition engines. These solutions consider pertinent assumptions, suitable boundary conditions, order of magnitude analysis, and dimensionless parameters [33], [34]. The flow was assumed to be turbulent, three-dimensional, incompressible, and steady. The analysis is based on a closed cycle with a constant volume of working fluid, but the elements are nonlinear and not uniformly spaced. Based on 3D Continuity and Navier Stokes Eqs. (1)-(3), represented in Cartesian coordinates, the mass and pressure dynamics of the in-cylinder charges at varying valve lifts were simulated while applying the boundary conditions:
I. Continuity equation: a continuity equation defines a conservation law by equating the net flux over the surface with a loss or gain of material within the surface [35]. In this case, the continuity equation is represented by Eq. (1) as either an integral or a differential equation:
∂u ∂u ∂u
+ + = 0. (1)
∂x ∂y ∂z II. Energy equation: this equation demonstrates that the change in energy of the fluid moving through the control volume is equal to the rate of heat transfer into the control volume plus the rates of work done by surface forces plus the rates of work done by gravity [36], [37] as given in Eq. (2).
∂ 1 2 ∂ 1 2 ∂ 1 2 ∂ 1 2 ∂ T
(ρe + ρv ) + (ρue + ρuv ) + (ρve + ρvv ) + (ρwe + ρwv ) = k ( +
∂t 2 ∂x 2 ∂y 2 ∂z 2 ∂x2
2 2 2 2
∂ T ∂ T ∂ρ ∂ρ ∂ρ ∂ u ∂ ∂v ∂w ∂ u ∂ ∂u
+ ) − (u + v + w ) + μ [u + (v + w ) + v + (u +
∂y2 ∂xz2 ∂x ∂y ∂z ∂x2 ∂x ∂x ∂x ∂y2 ∂y ∂y
2 2 2 2
∂w ∂ u ∂ ∂u ∂v ∂ u ∂u ∂v ∂ v ∂v ∂w ∂ w ∂w ∂u
w ) + w + (u + v )] + 2μ [u + + + + + ] +
∂y ∂z2 ∂z ∂z ∂z ∂x2 dy ∂x ∂y2 ∂z ∂y ∂z2 ∂x ∂z
ρugx + ρvgy + ρwgz.
III. Equations for momentum (Navier Stokes): the momentum equation, which forms the foundation of Newton's Second Law, links the overall force acting on a fluid element to its acceleration or rate of change of momentum [38], [39]. Newton's second law of motion, F = ma, is the foundation for the x, y, and z momentum equations, depicted in Eqs. (3a)-(3c).
2 2 2
∂u ∂u ∂u ∂ρ ∂ u ∂ u ∂ u
pu + ρv + ρw = + μ + μ + μ . (3a)
∂x ∂y ∂z ∂x ∂x2 ∂y2 ∂z2 2 2 2
∂v ∂v ∂v ∂ρ ∂ v ∂ v ∂ v
pu + ρv + ρw = + μ + μ + μ . (3b)
2 2 2
∂x ∂y ∂z ∂y ∂x ∂y ∂z 2 2 2
∂w ∂w ∂w ∂ρ ∂ w ∂ w ∂ w
pu + ρv + ρw = + μ + μ + μ . (3c)
2 2 2
∂x ∂y ∂z ∂z ∂x ∂y ∂z The rate of mass flow which enters the IC engine cylinder is resolved by Eq. (4a). Therefore, the rate of mass flow rate transiting the cylinder is shown in Eq. (4b).
m(x) = puF. (4a)
m(x + dx) = puF + (puF)dx. (4b)
The momentum conservation equation for the swirl velocity is expressed by Eq. (5). Thus, The strength of the swirl recorded can be evaluated by the swirl number (Sn) as shown in Eq. (6), while the ratio of axial flux (tangential momentum to the axial flux) of axial momentum times the effective nozzle radius as expressed as swirl intensity (Si) which is shown in Eq. (7).
∂ 1 ∂ 1 ∂ 1 ∂ ∂w 1 ∂ 3 ∂ w vw
(ρw) + (rρuw) + (rρvw) = [rμ ] + [r μ ( )] − ρ . (5)
∂t r ∂x r ∂r r ∂x ∂x r2 ∂r ∂r r r
∫ rwv ⃗ . d⃗A ⃗
Sn = . (6)
R ̅ ∫ uv ⃗ . d⃗A ⃗ Axial flux of tangential momentum 2π ∫ ρWUr dr
Si = = . (7)
Axial flux of axial momentum ∗ radius 2 R ∗ 2π ∫ ρWUr dr
The momentum equation states that the total of the pressure and shear forces within the cylinder of an ICE is equal to the sum of the rate of change of momentum within the cylinder and the net momentum that leaves the cylinder [40], [41]. Thus, the pressure and shear forces can be represented by Eqs. (8) and (9).
∂p ∂F dF ∂ dF
pF − (p + dx) (F + dx) + p dx = − (pF)dx + p dx. (8)
∂x ∂x dx ∂x dx pu
τ πDdx = −f πDdx. (9)
Thus, D can be expressed as the equivalent diameter which the wall shear stress τw is related to the friction factor, as shown in Eq. (10). Hence, the rate of change in momentum in the cylinder is shown in Eq. (11).
τw f = .
1 (10)
pu
(pFudx). (11)
Thus, the net efflux of momentum (net) in the cylinder is shown in Eq. (12), and the momentum equation forms the basis for the equations given in Eq. (13).
∂p ∂u dF ∂
2 2 (12)
(p + dx) (u + dx) (F + dx) − pu F = (pu F)dx.
∂x ∂x dx ∂x ∂ dF 1 ∂ ∂
2 2 (13)
− (pF)dx + p dx − f pu πDdx = (pFudx) + (pFu )dx.
∂x dx 2 ∂t ∂x Moreover, the specific stagnation enthalpy, specific internal energy, and energy equation for a fixed volume with the heat transfer rate are expressed by Eqs. (14)-(17).
CvT + + . (14)
C T + . (15)
∂(E)cv
Q − W = + (Net efflux of stagnation enthalpy). (16) Q = qρFdx. (17) Thus, q represents the heat transfer energy per unit mass per unit time, and Ws is the extemal rate of shear work. The rate of change in time (intemal energy in the cylinder )is given by Eq. (18), and the net efflux of stagnation enthalpy (in the cylinder) is shown in Eq. (19).
∂(E)cv ∂ u
= {(ρFdx) (CvT + )}. (18)
∂t ∂t 2 ∂ u p
{(ρuF) (CvT + + )} dx . (19)
∂x 2 ρ Resolving the substitution of Eqs. (17)-(19) with Eq. (16), the energy equation becomes ∂ u ∂ u p
qρFdx = {(ρFdx) (CvT + )} + {(ρuF) (CvT + + )} dx. (20)
∂t 2 ∂x 2 ρ The volumetric efficiency expressed in Eq. (21) can be expressed as the air mass (inducted) ratio into the cylinder and to the air mass that the cylinder volume can accommodate [42].
mg mg v9
= = = . (21)
mtn vth ∗ ρth vth Thus, ηv is the volumetric efficiency, mg is the actual mass of air inducted, mtn is the theoretical mass of air that the cylinder can accommodate, ρth is the density of ambient air, and v9 is the volume of air inducted while vth is the swept volume. The Effective Cam Duration (ECD) is the degree of cam rotation, as shown in Eq. (22).
(N ∗ RV ∗ Leff)
ECD = ( ) − 0.5D. (22)
(ECD ∗ 0.25 ∗ C ∗ 2) Thus, C is the speed of sound at intake temperature, N is the engine speed, RV is the number of reflections, D is the average runner diameter, and Leff is the effective length of the runner as expressed by Eq. (23) [43], [44].
(ECD ∗ 0.25 ∗ C ∗ 2)
Leff = ( ) − 0.5D. (23)
(N ∗ RV) The in-cylinder adiabatic flame temperature during combustion for a lean mixture is specified by Eqs. (24a)- (24c), and the in-cylinder adiabatic flame temperature for a rich mixture is specified by Eq. (25) [45].
m . LHV + (m + m )C ̅ (T − T )
f a f P.R R o
TR ≅ To + . (24a)
(m + m )C ̅
a f P.P
mf . LHV mf / ma . LHV
TR = TR + . (24b)
(m + m )C ̅ P (1 + m / m )C ̅ P
a f P. f a P.
f. LHV ∅ . fs . LHV
TR + = TR + . (24c)
(1 + f)C ̅ P (1 + ∅ . f )C ̅ P
P. s P.
fs . LHV fs . LHV
TP = TR + = TR + , (25)
(1 + f)C ̅ P (1 + ∅ . f )C ̅ P
P. s P.
where mf and ma are expressed as the mass of air and fuel, C ̅ is an average value of specific heat calculated at the average temperature of reactants and standard temperature, fS is the stoichiometric fuel/air ratio by mass, and TP is the adiabatic flame temperature. Intake of the four-stroke engine is governed by isentropic flow through a restriction, which is the poppet valve of the engine [46]. The equation governing this process is given by Eq. (26). However, it is a critical parameter in IC engines, as represented by Eq. (27).
dm CDARPO PT k 2k PT k−1
= ( ) { (1 − ( ) )} . (26)
( )0.5 dθ 6N RTO PO k − 1 PO
Cd = . (27)
(A ∗ sqrt(2 ∗ g ∗ h)) Cd is the flow coefficient, Q is the actual flow rate, A denotes the cross-sectional area of the flow passage, g denotes acceleration due to gravity, and h represents the pressure drop across the IC engine cylinder. The cylinder volume is a function of the crank angle and the piston rod length ratio to the crank (see Eq. (28)). However, the cylinder volume at any crank angle is represented by Eq. (29) [47].
Vd l l
√ 2 (28)
V = Vc + (1 + − cos θ − − sin θ).
2 c c
r − 1 1
2 2 0.5
V(θ) = Vc {1 + {1 − cosθ + [1 − (1 − ε sin θ) ]}}, (29)
where Vc is the clearance volume, r is the compression ratio, and is the piston stroke [48]. The internal energy of burned and unburned gases (see Eq. (30)) is expressed in terms of the specific heat (C ̅ ) in Eq. (31).
vi
o ̅ ′ ′
u ̅ = ∆u ̅ (T ) + ∫ C (T )dT . (30)
i fi o vi To
∫ (ai + biT)dT a b
T1 i i (31)
C ̅ = = + (T + T ),
vi 1 2
Mi (T2 − T1) Mi 2Mi where u ̅ denotes the internal energy of in-cylinder burned and unburned gases, while C ̅ is the specific heat
i vi
of the in-cylinder combusted gases.
2.1 ANSYS IC Engine Simulation
The model domain of the ICE was represented as a mesh, which included the fluid port of the engine. The mesh consisted of 689,651 nodes and 1,444,243 elements. The model's boundary physics, boundary conditions for the simulation, relaxation, pressure-velocity coupling, and discretization technique are all detailed in Table 2. The CFD approach was adopted to analyze and resolve the ICE port flow simulation using ANSYS FLUENT version 15.0. This approach employed the Finite Volume Method (FVM) of numerical analysis to solve the in-cylinder air's governing equations of motion and thermal energy. These equations include the continuity, Navier-Stokes, and energy equations [49]. ANSYS Fluent 15.0 version was applied as a simulation program of choice to examine the fluid flow, heat transport, and other physical phenomena necessary in the study. To utilize the ANSYS Fluent 15.0 version on the SOLIDWORKS CAD model, the SolidWorks CAD model profile was imported into the ANSYS Fluent 14.5 version as a geometry file saved in the Initial Graphics Exchange Specification (IGES) format. Once the geometry was imported, the simulation was initiated by specifying the parametric conditions, such as fluid characteristics, boundary conditions, and other necessary parameters for the study. Subsequently, simulations and analysis were conducted to understand the fluid flow and heat transfer better.
The software performed various functions, including verifying the geometry, preparing it, creating a mesh, configuring the solver, and constructing the default swirl plane based on the geometry data. It further established specific functionalities for custom fields within the swirl planes. Boundary conditions in CFDs involve specific requirements that must be satisfied at the boundaries of a simulation domain to solve a boundary value issue [50], [51]. The boundary conditions encompassed several types: inlet, exit, wall, constant pressure, axisymmetric, symmetric, and periodic or cyclic. Table 2 presents the thermodynamic parameters employed in the ANSYS ICE simulation.
Table 2. Boundary conditions for the ANSYS ICE simulation.
This table is shown in the PDF version of the article.
2.2 Mesh Report for the IC Engine Model
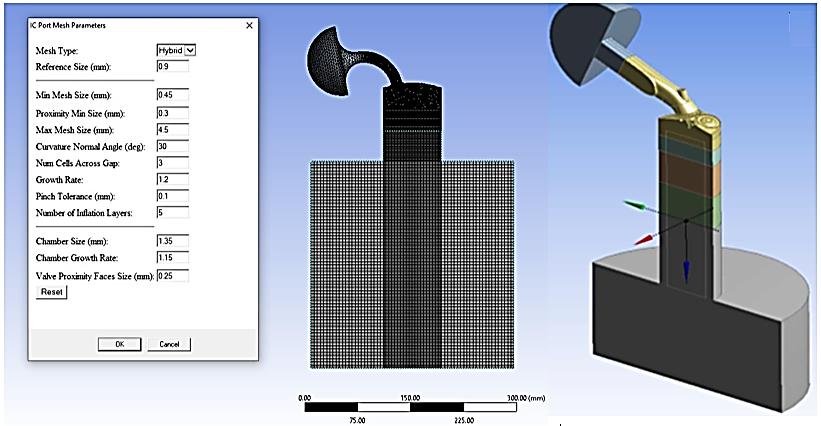
Segmenting the CFD domain into smaller elements, known as discretization, is essential yet demands substantial user input. Precision and high quality are crucial in performing this phase to ensure the final mesh is precise since it directly impacts the accuracy and correctness of the solution [52], [53]. Using a more refined mesh is essential in regions characterized by significant variations. In contrast, the components can be less refined in regions with less pronounced variations to minimize computing time. The mesh parameters were meticulously selected, especially for the regions close to the walls, to guarantee precise resolution of the valve and valve seat edges with a sufficiently small mesh size, ensuring an accurate representation of the flow characteristics in that specific location. The surface was initially segmented into triangular pieces, and subsequently, the remaining portion of the domain was filled with tetrahedral cells. Fig. 3 displays the CAD model and mesh visualization. To address the turbulent boundary layer on the solid surface domain and ensure proper meshing, a hybrid mesh with a reference size of 0.9 mm was used. The mesh size varied from 0.45 to 4.5 mm, with a curvature normal angle of 30 degrees. The group had a cell count of 3, a growth rate of 12, a pinch tolerance of 0.1 mm, 15 inflating layers, a chamber size of 1.35 mm, a chamber growth rate of 1.15, and a valve proximity face with a size of 0.25 mm.
3. Results and Discussion
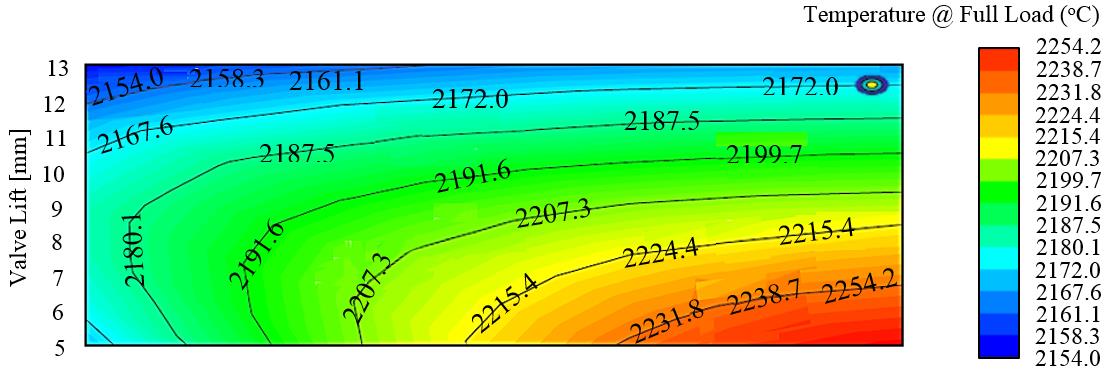
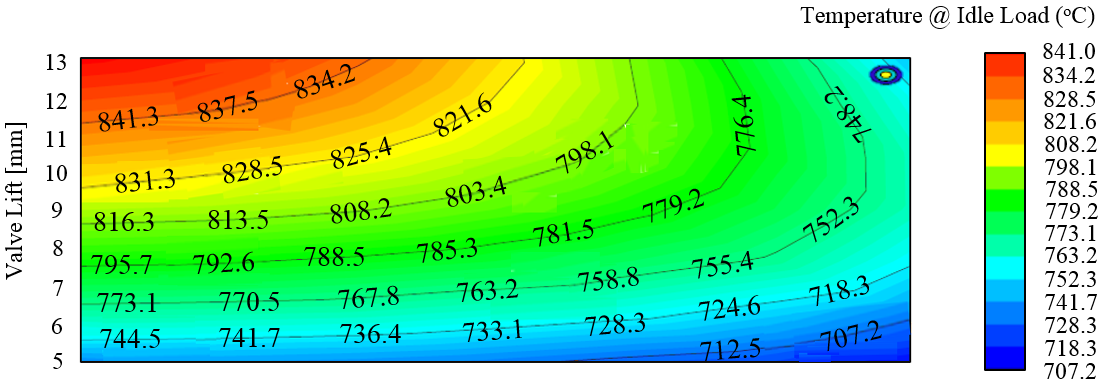
Fig. 4 illustrates the periodic fluctuations in the cylinder temperature during periods of 25% idle or low engine load. In contrast, Fig. 5 depicts the variations in-cylinder temperature during periods of 100% full engine load. The temperature within the cylinder ranged from 707-841oC at low load conditions and increased significantly to 2154-2254oC when the engine was at full load. This occurs due to the reduced temperature and pressure within the cylinder at idle load when the throttle is closed. Consequently, when the intake valve is shut, there is a diminished amount of air and fuel in the cylinder, resulting in decreased power output.
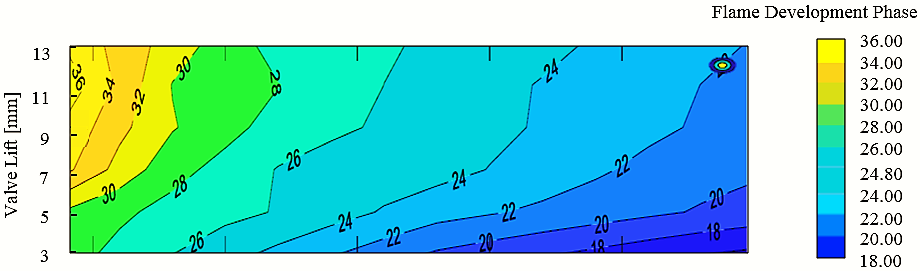
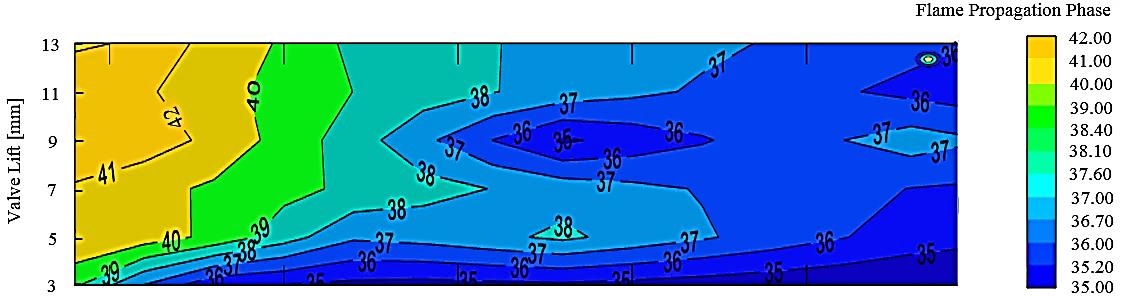
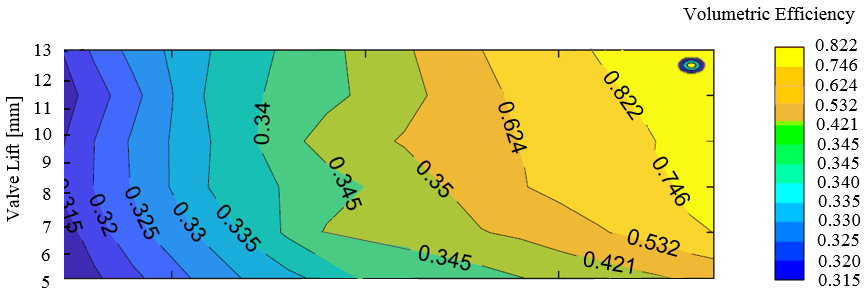
Conversely, increasing the throttle will quickly increase temperature and pressure within the intake cylinder, leading to a significant air and fuel mix intake to optimize engine performance [54], [55]. Therefore, the temperature and pressure within the cylinder are vital factors in the engine's performance. Fig. 6 illustrates the variations in the trajectory of the flame, whereas Fig. 7 depicts variations in the flame's propagation within the cylinder. The flames in an ICE cycle exhibit turbulent and unstable patterns when the premixed air-fuel reaches the combustion chamber. Turbulent conditions in the flame pressure enhance the dispersion of flame temperature as well as the flame speed, thus increasing the rate at which thermal reactions occur in the combustion vessel [56]. The transformation from the flame generation phase to the flame propagation phase is marked by a progressive rise in temperature and turbulence velocity within the cylinder. Elevated temperatures and prolonged engine operation also mark the flame propagation phase and, therefore, heightened engine load and velocity. Another research found that expanding the temperature of the cylinder resulted in a higher number of inflow vortices (ranging from 0.2 to 0.6 seconds). This, in turn, enhanced the recirculating zone in the furnace and induced the synthesis of combustion compounds within the internal recirculation zone [57]. This enables the effective blending of fuel-air mix, resulting in enhanced combustion efficiency by minimizing the regions of high temperature that generate Nitrogen Oxides (NOx) in the ICE. Furthermore, by augmenting the quantity of vortices, the radial dispersion of the flow is enhanced, leading to an expansion in the heat transfer surface area of the flame. Simultaneously, the highest temperature of the flame is diminished, resulting in an enhancement of the flow's radiation efficiency. The radial expansion of the flow in the combustion chamber leads to a uniform temperature distribution due to the rise in vortices generated by the drop in axial velocity and increase in tangential velocity [58]. Volumetric efficiency in ICEs measures the ratio or percentage of air inflow into the cylinder compared to the air released. Basically, it is the ratio of the mass of air-fuel mix in the cylinder during the intake stroke to the mass that would fill the same volume if the air density inside the cylinder matched that of the air around it. Fig. 8 illustrates the variations in volumetric efficiency inside the ICE cylinder. The valve lift variation ranging from 5 to 13 mm results in volumetric efficiencies ranging from 0.315 to 0.822, with 0.315 being the least and 0.822 being the highest. The optimum volumetric efficiency refers to the ideal possible quantity of air-fuel mix that can be introduced into the cylinder during the intake stroke cycle. This is due to the engine's need for the valve to open at higher rates to facilitate the inflow of charge into and out of the engine during the extended cycle. Volume efficiency can reach a maximum of 1.00 or 100%. With this figure, the engine can effectively assimilate the necessary amount of charge required for optimal operation.
3.1 Relationship between Valve Lift Openings and Flow Coefficient
Valve lift opening and flow coefficient, also known as discharge coefficient denoted by Cd, are crucial factors that significantly impact the performance of ICE. Valve lift opening refers to the distance that the valve moves off its seat to allow air and fuel mixture to enter the combustion chamber [59], [60]. The flow coefficient, on the other hand, measures how efficiently the air and fuel mixture flows through the valve and into the combustion chamber, which is dimensionless [61], [62]. Both factors play a key role in determining the overall performance of an IC engine. At valve lift opening of 5 mm, simulated at iterations of 5, 6, 7, 8, 9, 10, 11, 12, and 13 seconds, corresponding maximum flow coefficient of 0.08, 0.09, 0.1, 0.11, 0.12, 0.13, 0.14, 0.15 and 0.16, were observed as shown in Fig. 9.
Similarly, at valve lift opening of 13 mm, simulated at iterations of 5, 6, 7, 8, 9, 10, 11, 12, and 13 seconds, corresponding maximum flow coefficient of 0.2, 0.22, 0.24, 0.26, 0.27, 0.29, 0.31, 0.33 and 0.35, were observed as shown in Fig. 9. This implies that more air and fuel mixture enter the combustion chamber when the valve lift opening increases, improving engine performance. This is because a larger valve lift opening allows a greater volume of air and fuel to be introduced into the combustion chamber, resulting in more efficient combustion and increased power output. Similarly, a higher flow coefficient indicates that the air and fuel mixture can flow more freely through the valve, further enhancing engine performance. A higher flow coefficient reduces restrictions in the intake system, allowing for smoother airflow and improved combustion efficiency. When the valve is closed, the flow coefficient is zero because no air or fuel can pass through the valve. As the valve begins to open, the flow coefficient increases gradually, reaching its maximum value when it is fully open. This is because the larger the valve opening, the more air or fuel can flow through it. The relationship between valve lift opening and flow coefficient is not linear. At low valve lift openings, the flow coefficient increases slowly as the valve opens. However, as the valve lift opening increases, the flow coefficient increases rapidly until it reaches its maximum value when the valve is fully open. The plot of valve lift opening and flow coefficient typically shows a curve that starts at zero flow coefficient when the valve is closed, gradually increases as the valve opens, and reaches its peak when it is fully open. After reaching the maximum flow coefficient, the curve may start to decrease slightly as the valve opens further, but this decrease is usually minimal. The shape of the valve lift opening plot and flow coefficient can vary depending on the valve design and the engine. Factors such as the size and shape of the valve, the material it is made of, and the pressure of the air or fuel passing through it can all affect the relationship between valve lift opening and flow coefficient. By studying the plot of valve lift opening and flow coefficient, engineers can make informed decisions about the design and operation of engines to achieve the best possible performance. The plot of valve lift opening and flow coefficient can be used to optimize engine performance by finding the ideal balance between the two factors. By adjusting the valve lift opening and flow coefficient, engineers can fine-tune the engine to achieve maximum power output, fuel efficiency, emissions control, and optimum engine performance.
0/35 Valve lift = 5 mm 0/3 Valve lift = 6 mm Valve lift = 7 mm 0/25 Valve lift = 8 mm Valve lift = 9 mm Valve lift = 10 mm 0/15
Flow coefficient
Valve lift = 11 mm Valve lift = 12 mm 0/05 Valve lift = 13 mm 5 6 7 8 9 10 11 12 13
Iterations (s)
3.2 Relationship between Engine Speed and Volumetric Efficiency at Various Valve Lift Openings
The engine speed and volumetric efficiency at various valve lift openings greatly influence the performance of an IC engine. Engine speed refers to the number of Revolutions Per Minute (RPM) the engine operates at [63], [64]. Volumetric efficiency measures how effectively the engine can fill its combustion chambers with air and fuel [61], [65]. It is influenced by factors such as the design of the intake and exhaust systems, the size and shape of the combustion chambers, and the timing of the opening and closing of the valves. A higher volumetric efficiency means adequate air-fuel mixture is drawn into the combustion chamber, resulting in more efficient combustion and higher engine output. The valve lift opening, on the other hand, determines the amount of air and fuel mixture that can enter the combustion chamber. The size of the valve lift opening can significantly impact the engine's volumetric efficiency. A larger valve lift opening allows more air and fuel to be drawn into the combustion chamber, increasing the engine's volumetric efficiency and power output. However, if the valve lift opening is too large, it can lead to poor fuel atomization and incomplete combustion, reducing engine efficiency and increasing emissions. At higher engine speeds, the pistons reciprocate upward and downward more quickly, and the valve lift opening is larger, allowing more air and fuel to be drawn into the combustion chamber. This increases the engine's volumetric efficiency, resulting in better combustion and higher power output. However, the valves may not have enough time to fully open and close at very high engine speeds, leading to decreased volumetric efficiency.
On the other hand, at lower engine speeds, the valve lift opening is typically smaller, which restricts the flow of air and fuel into the cylinders. This results in lower volumetric efficiency, as the engine cannot take in as much air as it needs for optimal combustion. As a result, the engine may not produce enough power and torque, leading to poor performance. The relationship between engine speed, volumetric efficiency, and valve lift opening is crucial for optimizing the performance of an IC engine. By carefully adjusting these parameters, engineers can ensure that the engine operates at peak efficiency and delivers the desired power output. This is particularly important in applications where high performance and fuel efficiency are key considerations, such as in racing cars or high-performance vehicles. The relationship between engine speed, volumetric efficiency, and valve lift opening is complex and can vary depending on the design and configuration of the engine. Generally, a smaller valve lift opening may be sufficient to achieve high volumetric efficiency at lower engine speeds. However, as engine speed increases, a larger valve lift opening may be necessary to maintain high volumetric efficiency and power output. The plot of engine speed and volumetric efficiency at various valve lift openings typically shows a curve that starts from zero volumetric efficiencies when the engine is idle. The valve is closed, gradually increases as it opens, and reaches its peak at 0.904% when fully open at 13 mm. It also has an engine speed of 3000 rpm, as shown in Fig. 8. After attaining the maximum volumetric efficiency, the curve may start to decrease slightly as the valve opens further, but this decrease is usually minimal. The pattern of the plot of engine speed and volumetric efficiency at various valve lift openings can vary depending on the design of the valve and the engine. Factors such as the size and shape of the valve, the material it is made of, and the pressure of the air or fuel passing through it can all affect the relationship between valve lift opening, engine speed, and volumetric efficiency. By carefully understanding the relationship between engine speed and volumetric efficiency at various valve lift openings, engineers can optimize the design and operation of an engine to achieve the desired balance of power, efficiency, and performance.
0/92 Valve lift = 5 mm 0/9 Valve lift = 6 mm Valve lift = 7 mm 0/88 Valve lift = 8 mm 0/86 Valve lift = 9 mm valve lift = 10 mm 0/84 Valve lift = 11 mm 0/82
Volumetric Efficiency (%) Valve lift = 12 mm
0/8 valve lift = 13 mm 1000 2000 3000 4000 5000 6000
Engine Speed (rpm)
3.3 Relationship between Engine Speed and SFC at Various Valve Lift Openings
The plot of engine speed and SFC at various valve lift openings is a crucial aspect of understanding the performance of an IC engine. SFC measures the amount of fuel consumed per unit of power produced by the engine [66], [67]. This plot provides valuable insights into how the engine operates at different valve lift openings and how it affects fuel consumption. At its core, the plot of engine speed and SFC at various valve lift openings shows the relationship between the engine speed and the amount of fuel consumed per unit of power produced. This relationship is crucial because it directly impacts the efficiency and performance of the engine. At engine speeds of 2000, 2500, 3000, 3500, 4000, 4500, 5000, 5500, and 6000 rpm, the recorded maximum SFC was 0.205, 0.225, 0.245, 0.265, 0.29, 0.32, 0.365, 0.41 and 0.47 g/kWh, observed at valve lift opening of 13 mm. However, at valve lift openings of 5, 6, 7, 8, 9, 10, 11, 12 and 13 mm, corresponding maximum SFC of 0.37, 0.39, 0.4, 0.41, 0.42, 0.43, 0.445, 0.46 and 0.47 g/kWh, observed at engine speed of 600 rpm as shown in Fig. 11. This implies that, as the valve lift opening increases, the amount of air and fuel mixture entering the combustion chamber also increases, leading to higher power output from the engine. However, this also results in higher fuel consumption, as more fuel is required to maintain the combustion process at higher power levels or engine speeds. The plot of engine speed and SFC at various valve lift openings can help engineers optimize an engine's performance by finding the ideal balance between power output and fuel consumption. The importance of SFC lies in its direct correlation to the engine's efficiency. By analyzing the data from these plots, engineers can determine the most efficient operating conditions for the engine, maximizing power output while minimizing fuel consumption. Furthermore, the plot of engine speed and SFC at various valve lift openings can also be used to compare the performance of different engines or engine configurations. By analyzing the data from these plots, engineers can identify the strengths and weaknesses of different engine designs, helping them make informed decisions about which design is best suited for a particular application.
0/5 Valve lift = 5 mm 0/45 Valve lift = 6 mm 0/4 Valve lift = 7 mm Valve lift = 8 mm 0/35 Valve lift = 9 mm Valve lift = 10 mm 0/25 Valve lift = 11 mm
SFC (g/kWh) 0/2
Valve lift = 12 mm 0/15 Valve lift = 13 mm 2000 2500 3000 3500 4000 4500 5000 5500 6000
Engine Speed (rpm)
3.4 Relationship between Engine Speed and Indicated Power at Various Valve Lift Openings
The plot of engine speed and indicated power at various valve lift openings is a crucial aspect of understanding the performance of an IC engine. This plot provides valuable insights into how the engine operates at different valve lift openings and how this impacts its overall performance. At its core, engine speed refers to the number of RPM the engine's crankshaft makes. This is a key factor in determining the engine's power output, as higher engine speeds typically result in higher power outputs. At engine speeds of 2000, 2500, 3000, 3500, 4000, 4500, 5000, 5500, and 6000 rpm, the recorded maximum indicated powers were 44, 46, 48, 50, 52, 54, 56, 58 and 60 KW, observed at valve lift opening of 13 mm. However, at valve lift openings of 5, 6, 7, 8, 9, 10, 11, 12, and 13 mm, corresponding maximum indicated powers of 22, 34, 43, 48, 53, 56, 58, 59, and 60 KW, observed at an engine speed of 600 rpm as shown in Fig. 12. This implies that, as the engine speed increases, so does its power output, up to a certain point where it reaches its maximum power output. In this case, the valve lift opening is crucial in determining how much air and fuel can enter the combustion chamber, affecting the engine's power output. Indicated power, conversely, is the power produced by the engine's pistons as they move up and down in the cylinders [68], [69]. In an actual scenario, this power is measured using an indicator diagram, which visually represents the pressure inside the cylinder as the piston moves. However, the ANSYS analytical tool employed in this study modelled and simulated the engine speed and indicated power at various valve lift openings. This plot can help identify the optimal valve lift setting for maximizing power output while maintaining fuel efficiency and minimizing emissions. Furthermore, the plot of engine speed and indicated power at various valve lift openings can also be used to analyze the engine's efficiency at different operating conditions. Engineers can fine-tune the engine's performance to achieve the desired balance between power, efficiency, and emissions by studying how the power output changes with varying valve lift openings.
Valve lift = 5 mm Valve lift = 6 mm
50. Valve lift = 7 mm
45. Valve lift = 8 mm
40. Valve lift = 9 mm
35. Valve lift = 10 mm
30. Valve lift = 11 mm
Indicated Power (Kw)
25. Valve lift = 12 mm
20. Valve lift = 13 mm
1500 2500 3500 4500 5500
Engine Speed (rpm)
4. Conclusion
This research paper on the computational study of valve lift dynamics and stoichiometric behaviour of four-stroke Renault IC engines has provided valuable insights into the performance and efficiency of this engine. The study has highlighted the significance of maintaining stoichiometric behaviour in the combustion process to ensure optimal fuel efficiency. One of the key findings from these studies is that, by adjusting the valve lift profile of the intake and exhaust valves, the engine's power output and efficiency can be improved. Furthermore, the study demonstrated the importance of maintaining proper stoichiometric ratios in the combustion chamber to complete the combustion of the fuel-air mixture. The findings also underscore the importance of continuous research and development in engine optimization. By further exploring and refining these concepts, engineers, and researchers can continue to improve the performance, efficiency, and environmental impact of ICEs; future studies must build upon the existing research to drive innovation and advancements in the automotive industry. In light of the findings of this study, the following recommendations are suggested to improve the design, operation, and performance of the Renault IC engine:
I. It is vital to optimize the valve lift dynamics of the engine to ensure efficient combustion and maximum power output. This can be achieved by carefully designing the camshaft profiles and valve timing to ensure the valves open and close optimally during the engine cycle.
II. The stoichiometric behaviour of the engine must be carefully monitored and controlled to ensure that the air-fuel mixture is at the ideal ratio for combustion. This can be achieved using advanced engine management systems that adjust the fuel injection and ignition timing in real time to maintain the stoichiometric ratio under varying operating conditions.
III. Considering the impact of engine speed and load on the engine's valve lift dynamics and stoichiometric behaviour is crucial. This study has shown that these factors can significantly affect the performance and efficiency of the engine and must be carefully considered during the design and tuning process.
IV. Future research should focus on developing advanced control strategies to dynamically adjust the valve lift profile based on the engine's operating conditions.
By implementing the recommendations outlined in this study, engineers can optimize the design and operation of these engines to achieve maximum power output and fuel efficiency.
Hence, this study has contributed to understanding the valve lift dynamics and stoichiometric behaviour of IC engines, paving the way for more efficient and environmentally friendly engine designs.
Author Contribution
Aniekan Ikpe: Methodology, modelling, and computation; Enefiok Usungurua: Writing, conceptualization, and editing; Imoh Ekanem: Interpretation of result. All authors have read and agreed to the publication of this research work.
Funding
The authors affirm that they received no funding or support for this research work, including any administrative, technical, or material assistance.
Data Availability
This manuscript contains all the data supporting the various conclusions from this research work.
Conflicts of Interest
The authors affirm no conflicts of interest with the findings derived in this research work. No second or third party was involved in the conceptualization, data collection, analysis, data interpretation, or decision-making on the publication of results achieved.
References
- [1] Balmelli, M., Zsiga, N., Merotto, L., & Soltic, P. (2020). Effect of the intake valve lift and closing angle on part load efficiency of a spark ignition engine. Energies, 13(7), 1682. https://doi.org/10.3390/en13071682
- [2] Wang, J., Duan, X., Wang, W., Guan, J., Li, Y., & Liu, J. (2021). Effects of the continuous variable valve lift system and Miller cycle strategy on the performance behavior of the lean-burn natural gas spark ignition engine. Fuel, 297, 120762. https://doi.org/10.1016/j.fuel.2021.120762
- [3] Reitz, R. D., Ogawa, H., Payri, R., Fansler, T., Kokjohn, S., Moriyoshi, Y., ... & Zhao, H. (2020). The future of the internal combustion engine. International journal of engine research, 21(1), 3-10.
- [4] Castro, D. M., & Silv Parreiras, F. (2021). A review on multi-criteria decision-making for energy efficiency in automotive engineering. Applied computing and informatics, 17(1), 53–78. https://doi.org/10.1016/j.aci.2018.04.004
- [5] Badra, J. A., Khaled, F., Tang, M., Pei, Y., Kodavasal, J., Pal, P., … & Aamir, F. (2021). Engine combustion system optimization using computational fluid dynamics and machine learning: a methodological approach. Journal of energy resources technology, 143(2), 22306. https://doi.org/10.1115/1.4047978
- [6] Iranzo, A. (2019). CFD applications in energy engineering research and simulation: an introduction to published reviews. Processes, 7(12), 883. https://doi.org/10.3390/pr7120883
- [7] Rakopoulos, D. C. (2021). Effects of exhaust gas recirculation under fueling rate or air/fuel ratio-- controlled strategies on diesel engine performance and emissions by two-zone combustion modeling. Journal of energy engineering, 147(1), 4020079. https://doi.org/10.1061/(ASCE)EY.1943-7897.0000729
- [8] Aliramezani, M., Koch, C. R., & Shahbakhti, M. (2022). Modeling, diagnostics, optimization, and control of internal combustion engines via modern machine learning techniques: A review and future directions. Progress in energy and combustion science, 88, 100967. https://doi.org/10.1016/j.pecs.2021.100967
- [9] Yang, X., Keum, S., & Kuo, T.-W. (2016). Effect of valve opening/closing setup on computational fluid dynamics prediction of engine flows. Journal of engineering for gas turbines and power, 138(8), 81503. https://doi.org/10.1115/1.4032342
- [10] Sawant, P., & Bari, S. (2018). Effects of variable intake valve timings and valve lift on the performance and fuel efficiency of an internal combustion engine. https://doi.org/10.4271/2018-01-0376
- [11] Babagiray, M., Kocakulak, T., Ardebili, S. M. S., Solmaz, H., Çınar, C., & Uyumaz, A. (2022). Experimental and statistical investigation of different valve lifts on HCCI combustion, performance and exhaust emissions using response surface method. Energy, 244, 123184. https://doi.org/10.1016/j.energy.2022.123184
- [12] Bayramoğlu, K., Yilmaz, S., & Kaya, K. D. (2019). Numerical investigation of valve lifts effects on performance and emissions in diesel engine. International journal of global warming, 18(3–4), 287–303. https://doi.org/10.1504/IJGW.2019.101088
- [13] Mokrane, C., Adouane, B., & Benzaoui, A. (2018). Composition and stoichiometry effects of biogas as fuel in spark ignition engine. International journal of automotive and mechanical engineering, 15(1), 5036–5052. https://doi.org/10.15282/ijame.15.1.2018.11.0390
- [14] Costa, M., Catapano, F., Sementa, P., Sorge, U., & Vaglieco, B. M. (2016). Mixture preparation and combustion in a GDI engine under stoichiometric or lean charge: an experimental and numerical study on an optically accessible engine. Applied energy, 180, 86–103. https://doi.org/10.1016/j.apenergy.2016.07.089
- [15] Houshfar, E., Skreiberg, Ø., Løvås, T., Todorović, D., & Sørum, L. (2011). Effect of excess air ratio and temperature on NOx emission from grate combustion of biomass in the staged air combustion scenario. Energy & fuels, 25(10), 4643–4654. https://doi.org/10.1021/ef200714d
- [16] Al-Arkawazi, S. A. F. (2019). Analyzing and predicting the relation between air--fuel ratio (AFR), lambda ($λ$) and the exhaust emissions percentages and values of gasoline-fueled vehicles using versatile and portable emissions measurement system tool. SN applied sciences, 1(11), 1370. https://doi.org/10.1007/s42452-019-1392-5
- [17] Chen, Z., Liao, B., Yu, Y., & Qin, T. (2022). Effect of equivalence ratio on spark ignition combustion of an air-assisted direct injection heavy-fuel two-stroke engine. Fuel, 313, 122646. https://doi.org/10.1016/j.fuel.2021.122646
- [18] Manivannan, P. V, Singaperumal, M., & Ramesh, A. (2014). A new method for measurement of air--fuel ratio based on the response time of binary-type exhaust gas oxygen (BEGO) sensor for application in small spark ignition (SI) engines. Transactions of the institute of measurement and control, 36(2), 175–183. https://doi.org/10.1177/0142331213493803
- [19] Bérubé, Y., Ghazanfari, A., Blanchette, H. F., Perreault, C., & Zaghib, K. (2020). Recent advances in wide bandgap devices for automotive industry. IECON 2020 the 46th annual conference of the ieee industrial electronics society (pp. 2557–2564). IEEE.
- [20] Maroteaux, D., Le Guen, D., & Chauvelier, E. (2015). Development of a fuel economy and co 2 simulation platform for hybrid electric vehicles-application to renault eolab prototype. https://doi.org/10.4271/2015-24-2543
- [21] Laget, O., Richard, S., Serrano, D., & Soleri, D. (2012). Combining experimental and numerical investigations to explore the potential of downsized engines operating with methane/hydrogen blends. International journal of hydrogen energy, 37(15), 11514–11530. https://doi.org/10.1016/j.ijhydene.2012.03.153
- [22] Netzer, C., Pasternak, M., Seidel, L., Ravet, F., & Mauss, F. (2020). Computationally efficient prediction of cycle-to-cycle variations in spark-ignition engines. International journal of engine research, 21(4), 649–663. https://doi.org/10.1177/1468087419856493
- [23] Ikpe, A., & Bassey, M. (2024). Computational fluid dynamics of four stroke in-cylinder charge behavior at distinct valve lift opening clearance in spark ignition reciprocating internal combustion renault engine. International journal of automotive science and technology, 8(1), 1–22. https://doi.org/10.30939/ijastech..1337386
- [24] Clenci, A., Bîzîiac, A., Podevin, P., Descombes, G., Deligant, M., & Niculescu, R. (2013). Idle operation with low intake valve lift in a port fuel injected engine. Energies, 6(6), 2874–2891. https://doi.org/10.3390/en6062874
- [25] Ikpe, A. (2020). Design analysis of reciprocating piston for single cylinder internal combustion engine. International journal of automotive science and technology, 4(2), 30–39. https://doi.org/10.30939/ijastech..702219
- [26] Ikpe, A. E., & Owunna, I. B. (2022). Modelling the performance characteristics of four stroke internal combustion renault engine cycle using matlab simulation tool. ARID zone journal of engineering, technology and environment, 18(2), 267–280.
- [27] Kumar, H., & Jayashankar, N. (2015). Port flow simulation of an IC engine. International journal of innovations in engineering research and technology, 2(9), 1–9.
- [28] Akele, S. M. G., Aganama, C., Emeka, E., Abudu-Mimini, Y., Umukoro, S., & Raymond, O. (2020). CFD port flow simulation of air flow rate in spark ignition engine. International journal of engineering and management research (IJEMR), 10(6), 87–95. http://dx.doi.org/10.31033/ijemr.10.6.13
- [29] Ikpe, A. E., Owunna, I. B., & John, P. O. (2021). Port flow simulation and in-cylinder swirl motion characteristic effects in internal combustion engine duty cycle. Applications of modelling and simulation, 5, 102–114. http://arqiipubl.com/ojs/index.php/AMS_Journal/article/view/254
- [30] Essienubong, I. A., & Bismarck, O. I. (2021). Simulation of mass and pressure dynamics of in-cylinder charges at variable valve lift clearance in four stroke spark ignition engine. Advances in engineering design technology, 3, 115–131. https://doi.org/10.37933/nipes.a/3.2.2021.
- [31] Schneiderbauer, S., & Krieger, M. (2013). What do the Navier--Stokes equations mean? European journal of physics, 35(1), 15020. DOI:10.1088/0143-0807/35/1/015020
- [32] Kumar, M., & Kumar, R. (2014). On some new exact solutions of incompressible steady state Navier-Stokes equations. Meccanica, 49, 335–345.
- [33] Hamlington, P. E., & Ihme, M. (2014). Modeling of non-equilibrium homogeneous turbulence in rapidly compressed flows. Flow, turbulence and combustion, 93, 93–124. https://doi.org/10.1007/s10494-014-9535-7
- [34] Hamel, J. M., Allphin, D., & Elroy, J. (2018). Multi-objective optimization model development to support sizing decisions for a novel reciprocating steam engine technology. Journal of energy resources technology, 140(7), 72204. https://doi.org/10.1115/1.4039611
- [35] Dresback, K. M., Kolar, R. L., & Dietrich, J. C. (2005). On the form of the momentum equation for shallow water models based on the generalized wave continuity equation. Advances in water resources, 28(4), 345–
- [358] https://doi.org/10.1016/j.advwatres.2004.11.011
- [36] Moran, M. J., Shapiro, H. N., Munson, B. R., & DeWitt, D. P. (2002). Introduction to thermal systems engineering: thermodynamics, fluid mechanics, and heat transfer. John Wiley & Sons.
- [37] Raju, K. S. (2011). Fluid mechanics, heat transfer, and mass transfer: chemical engineering practice. John Wiley & Sons.
- [38] Caltagirone, J. P. (2024). An alternative to the Navier--Stokes equation based on the conservation of acceleration. Journal of fluid mechanics, 978, A21. https://doi.org/10.1017/jfm.2023.1017
- [39] Hjelmstad, K. D., & Hjelmstad, K. D. (2022). Foundations of dynamics. In Fundamentals of structural dynamics: theory and computation (pp. 1–21). Springer.
- [40] Banaeizadeh, A., Afshari, A., Schock, H., & Jaberi, F. (2013). Large-eddy simulations of turbulent flows in internal combustion engines. International journal of heat and mass transfer, 60, 781–796. https://doi.org/10.1016/j.ijheatmasstransfer.2012.12.065
- [41] Giannakopoulos, G. K., Frouzakis, C. E., Boulouchos, K., Fischer, P. F., & Tomboulides, A. G. (2017). Direct numerical simulation of the flow in the intake pipe of an internal combustion engine. International journal of heat and fluid flow, 68, 257–268. https://doi.org/10.1016/j.ijheatfluidflow.2017.09.007
- [42] Ibrahim, A., & Bari, S. (2009). Effect of varying compression ratio on a natural gas SI engine performance in the presence of EGR. Energy & fuels, 23(10), 4949–4956. https://doi.org/10.1021/ef900452q
- [43] Winterbone, D. E., & Yoshitomi, M. (1990). The accuracy of calculating wave action in engine intake manifolds. https://doi.org/10.4271/900677
- [44] Chalet, D., Mahe, A., Migaud, J., & Hetet, J. F. (2011). A frequency modelling of the pressure waves in the inlet manifold of internal combustion engine. Applied energy, 88(9), 2988–2994. https://doi.org/10.1016/j.apenergy.2011.03.036
- [45] Ikpe, A. E., & Owunna, I. B. (2020). A 3D modelling of the in-cylinder combustion dynamics of two stroke internal combustion engine in its service condition. Nigerian journal of technology, 39(1), 161–172. https://doi.org/10.4314/njt.v39i1.18
- [46] Owunna, I. B., & Ikpe, A. E. (2021). Comparative analysis of four stroke and six stroke internal combustion renault engine efficiency using matlab simulation tool. Nigerian journal of engineering, 28(3), 62–69.
- [47] Ramachandran, S. (2009). Rapid thermodynamic simulation model of an internal combustion engine on alternate fuels. Proceedings of the international multiconference of engineers and computer scientists (Vol. 2, pp. 2146–2151). SN.
- [48] Ferguson, C. R., & Kirkpatrick, A. T. (2015). Internal combustion engines: applied thermosciences. John Wiley & Sons.
- [49] Essienubong, I. A., Ikechukwu, O., & Paul, S. (2018). Finite element analysis of aircraft tire behaviour under overloaded aircraft landing phase. Aeron aero open access journal, 2(1), 32–37.
- [50] Blocken, B. (2015). Computational fluid dynamics for urban physics: importance, scales, possibilities, limitations and ten tips and tricks towards accurate and reliable simulations. Building and environment, 91, 219–245. https://doi.org/10.1016/j.buildenv.2015.02.015
- [51] Oberkampf, W. L., & Trucano, T. G. (2002). Verification and validation in computational fluid dynamics. Progress in aerospace sciences, 38(3), 209–272. https://doi.org/10.1016/S0376-0421(02)00005-2
- [52] Khaled, M. F., Aly, A. M., & Elshaer, A. (2021). Computational efficiency of CFD modeling for building engineering: An empty domain study. Journal of building engineering, 42, 102792. https://doi.org/10.1016/j.jobe.2021.102792
- [53] Tezzele, M., Demo, N., Stabile, G., Mola, A., & Rozza, G. (2020). Enhancing CFD predictions in shape design problems by model and parameter space reduction. Advanced modeling and simulation in engineering sciences, 7, 1–19. https://doi.org/10.1186/s40323-020-00177-y%0A%0A
- [54] Ravi, K., Bhasker, J. P., & Porpatham, E. (2017). Effect of compression ratio and hydrogen addition on part throttle performance of a LPG fuelled lean burn spark ignition engine. Fuel, 205, 71–79. https://doi.org/10.1016/j.fuel.2017.05.062
- [55] Abdullah, N. R., Shahruddin, N. S., Mamat, R., Mamat, A. M. I., & Zulkifli, A. (2014). Effects of air intake pressure on the engine performance, fuel economy and exhaust emissions of a small gasoline engine. Journal of mechanical engineering and sciences, 6, 949–958. https://doi.org/10.15282/jmes.6.2014.21.0091
- [56] Raghuram, P., Ramkumar, P., Sreenivasan, M., & Puhan, S. (2012). Air-fuel ratio calculations in an internal combustion engine based on the cylinder pressure measurements. International journal of engineering research and applications, 2(6), 1378–1385.
- [57] Ikpe, A. E., Bassey, M. O., & David, V. O. (2023). Computation of in-cylinder transient thermodynamics and valve lift effects on four stroke reciprocating piston internal combustion engine [presentation]. 3th international liberty interdisciplinary conference. https://www.researchgate.net/profile/Michael-Bassey-4/publication/367360917_COMPUTATION_OF_IN-CYLINDER_TRANSIENT_THERMODYNAMIC_conference/links/63cf6cd9e922c50e99bb53a1/COMPU TATION-OF-IN-CYLINDER-TRANSIENT-THERMODYNAMIC-conference.pdf
- [58] Hosseini, A. A., Ghodrat, M., Moghiman, M., & Pourhoseini, S. H. (2020). Numerical study of inlet air swirl intensity effect of a methane-air diffusion flame on its combustion characteristics. Case studies in thermal engineering, 18, 100610. https://doi.org/10.1016/j.csite.2020.100610
- [59] Millo, F., Luisi, S., Borean, F., & Stroppiana, A. (2014). Numerical and experimental investigation on combustion characteristics of a spark ignition engine with an early intake valve closing load control. Fuel, 121, 298–310. https://doi.org/10.1016/j.fuel.2013.12.047
- [60] Bonnick, A., Newbold, D., & Dennis, K. (2006). Fuel systems. In A practical approach to motor vehicle engineering and maintenance (pp. 95–137). Routledge.
- [61] Yaliwal, V. S., Banapurmath, N. R., Gireesh, N. M., Hosmath, R. S., Donateo, T., & Tewari, P. G. (2016). Effect of nozzle and combustion chamber geometry on the performance of a diesel engine operated on dual fuel mode using renewable fuels. Renewable energy, 93, 483–501. https://doi.org/10.1016/j.renene.2016.03.020
- [62] Yan, B., Wang, H., Zheng, Z., Qin, Y., & Yao, M. (2018). The effect of combustion chamber geometry on in-cylinder flow and combustion process in a stoichiometric operation natural gas engine with EGR. Applied thermal engineering, 129, 199–211. https://doi.org/10.1016/j.applthermaleng.2017.09.067
- [63] Janulevičius, A., Juostas, A., & Pupinis, G. (2013). Engine performance during tractor operational period. Energy conversion and management, 68, 11–19. https://doi.org/10.1016/j.enconman.2013.01.001
- [64] Papagiannakis, R. G., Rakopoulos, C. D., Hountalas, D. T., & Rakopoulos, D. C. (2010). Emission characteristics of high speed, dual fuel, compression ignition engine operating in a wide range of natural gas/diesel fuel proportions. Fuel, 89(7), 1397–1406. https://doi.org/10.1016/j.fuel.2009.11.001
- [65] Masi, M., & Gobbato, P. (2012). Measure of the volumetric efficiency and evaporator device performance for a liquefied petroleum gas spark ignition engine. Energy conversion and management, 60, 18–27. https://doi.org/10.1016/j.enconman.2011.11.030
- [66] Elavarasan, G., Kannan, M., & Karthikeyan, D. (2019). Experimental analysis to find the optimum specific fuel consumption for driver’s intimation. International journal of recent technology and engineering, 8(2), 452–
- [456] DOI:10.35940/ijrte.B1517.078219
- [67] Saputro, E. A., & Saputro, W. (2022). Analysis of combustion temperature on specific fuel consumption (SFC) of Diesel engines using b30 fuel in the long term performance. Nusantara science and technology proceedings, 22, 362–366. https://doi.org/10.11594/nstp.2022.2754
- [68] Jia, B., Tian, G., Feng, H., Zuo, Z., & Roskilly, A. P. (2015). An experimental investigation into the starting process of free-piston engine generator. Applied energy, 157, 798–804. https://doi.org/10.1016/j.apenergy.2015.02.065
- [69] Jia, B., Smallbone, A., Zuo, Z., Feng, H., & Roskilly, A. P. (2016). Design and simulation of a two-or four-stroke free-piston engine generator for range extender applications. Energy conversion and management, 111, 289–298. https://doi.org/10.1016/j.enconman.2015.12.063